HOLISMOKES XX. Lens models of binary lens galaxies with five images of Supernova Winny
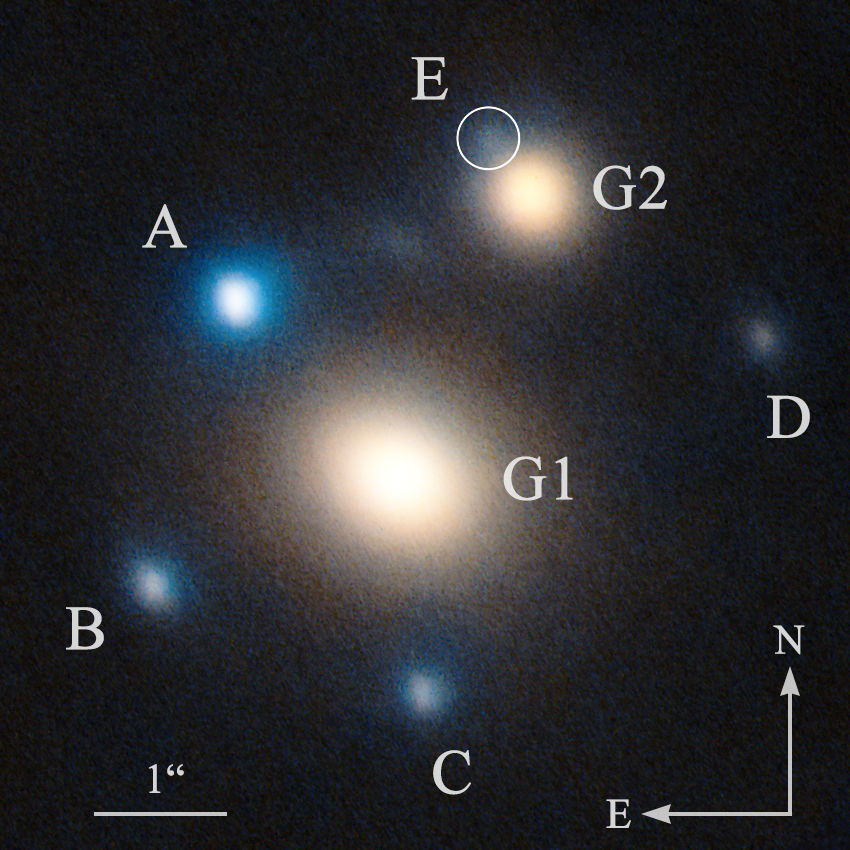
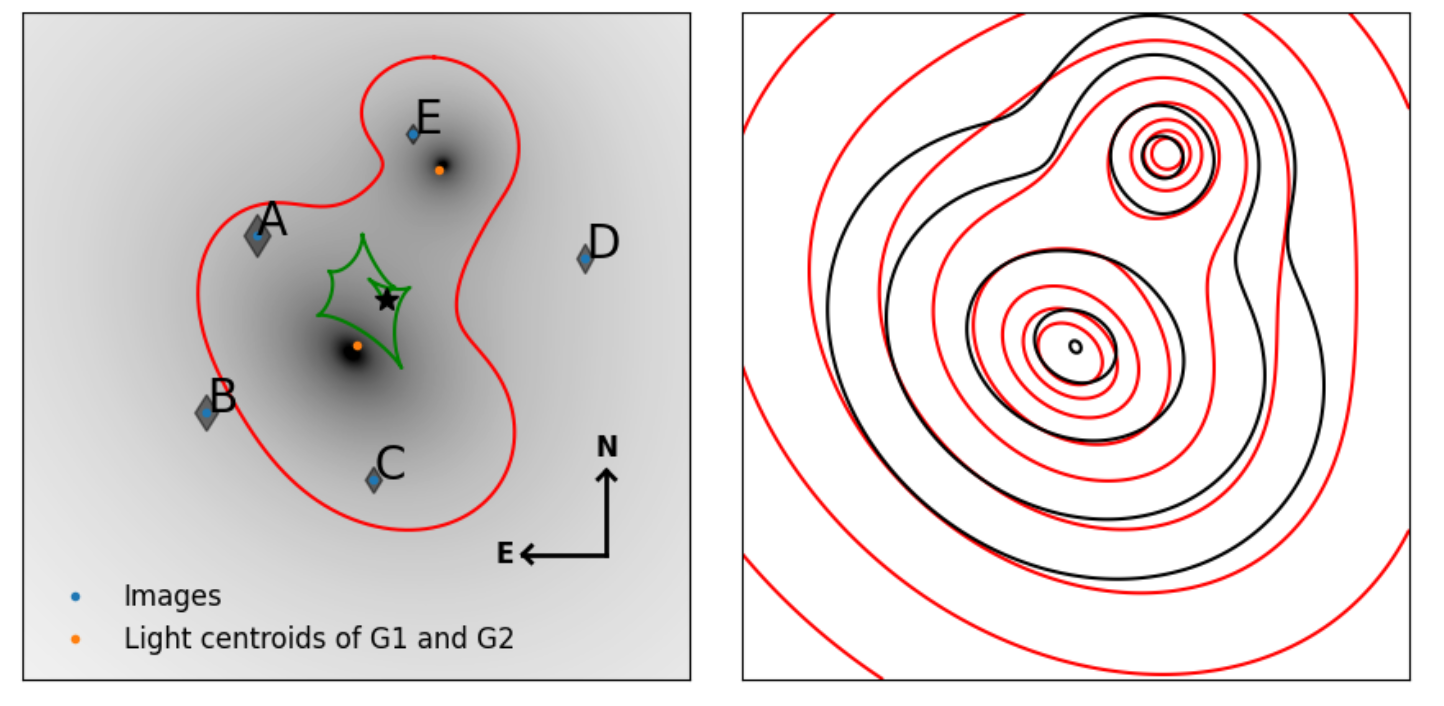
Strongly lensed supernovae (SNe) provide a powerful way to study cosmology, SNe and galaxies. Modelling the lens system is key to extracting astrophysical and cosmological information. We present adaptive-optics-assisted high-resolution images of the recently discovered SN Winny (SN 2025wny) in the J and K filters obtained with the Large Binocular Telescope. The high-resolution adaptive optics LBT imaging confirms the presence of a fifth point source, whose colour is consistent with that of the other SN images at similar phases, while lens modelling robustly supports its interpretation as an additional image of SN Winny. We measure the positions of the five SN images with uncertainties varying between 1 and 14 milliarcseconds. Using the five SN image positions as constraints and the centroids of the lens light distributions as priors for their mass centroids, we build the first mass models using two different pieces of software, lenstronomy and GLEE. We explored three classes of mass models for the two lens galaxies G1 and G2 involving singular isothermal sphere (SIS), singular isothermal ellipsoid (SIE) and external shear profiles. The optimal model class, based on the Bayesian Information Criterion, is an SIE for G1, an SIS for G2, and an external shear for both lenstronomy and GLEE. From the lens modelling, we infer the enclosed masses within the Einstein radius as MG1(<θE) = 4.61+0.06 −0.04 ×10¹¹ M⊙ for G1 and MG2(<θE) = 1.01±0.02×10¹¹ M⊙ for G2. The lensing configuration by the two lens galaxies can produce two additional magnified SN images beyond the five observed ones; the exclusion of such model configurations further constrains the lens mass model parameters. Our model fits to the observed image positions with an RMS of ∼0.0012''−0.0025'', within the observed positional uncertainties and without additional predicted SN images. The predicted magnifications of the multiple images vary between ∼1.6 (for the faintest fifth image E) to ∼10 (for the brightest image A). The predicted relative lensing magnifications of the multiple images do not match that of the observed within 2σ uncertainties. The differences in the relative magnifications could be due to millilensing and microlensing effects. Our mass models form the basis for future analyses of this unique system.