HOLISMOKES III. Achromatic phase of strongly lensed Type Ia supernovae
To use strongly lensed Type Ia supernovae (LSNe Ia) for cosmology, a time-delay measurement between the multiple supernova (SN) images is necessary. In principle photometry and spectroscopy can be used for the delay measurement, but microlensing can highly distort spectra and light curves (Yahalomi et al. 2017; Goldstein et al. 2018; Foxley-Marrable et al. 2018; Huber et al. 2019; Pierel & Rodney 2019) and therefore add large uncertainties to the measurements. Color curves have the advantage that if microlensing is similar in different filters, it cancels out in the color curves. This was first investigated by Goldstein et al. (2018), who find for the spherically symmetric W7 model (Nomoto et al.1984) that microlensing in the color curves of LSNe Ia is almost negligible for about 3 rest-frame weeks after explosion, which is referred to as the achromatic phase.
In this work, we investigate the achromatic phase further. We use the radiative transfer code ARTIS (Kromer & Sim 2009), instead of SEDONA (Kasen et al. 2006) that was used by Goldstein et al. 2018. We test four SN Ia models instead of one, where also effects of asymmetries are taken into account. This is an important independent analysis of the achromatic phase pointed out by Goldstein et al. (2018). The good news is that our results agree with Goldstein et al. (2018), and we find on average an achromatic phase of around three rest-frame weeks or longer for most color curves, but the spread in the duration of the achromatic phase (due to different microlensing maps and filter combinations) is quite large and an achromatic phase of just a few days is also possible. Furthermore, the achromatic phase is longer for smoother microlensing maps and lower macro-magnifications. From our investigations, we do not find a strong dependency on the SN model or on asymmetries in the SN ejecta.
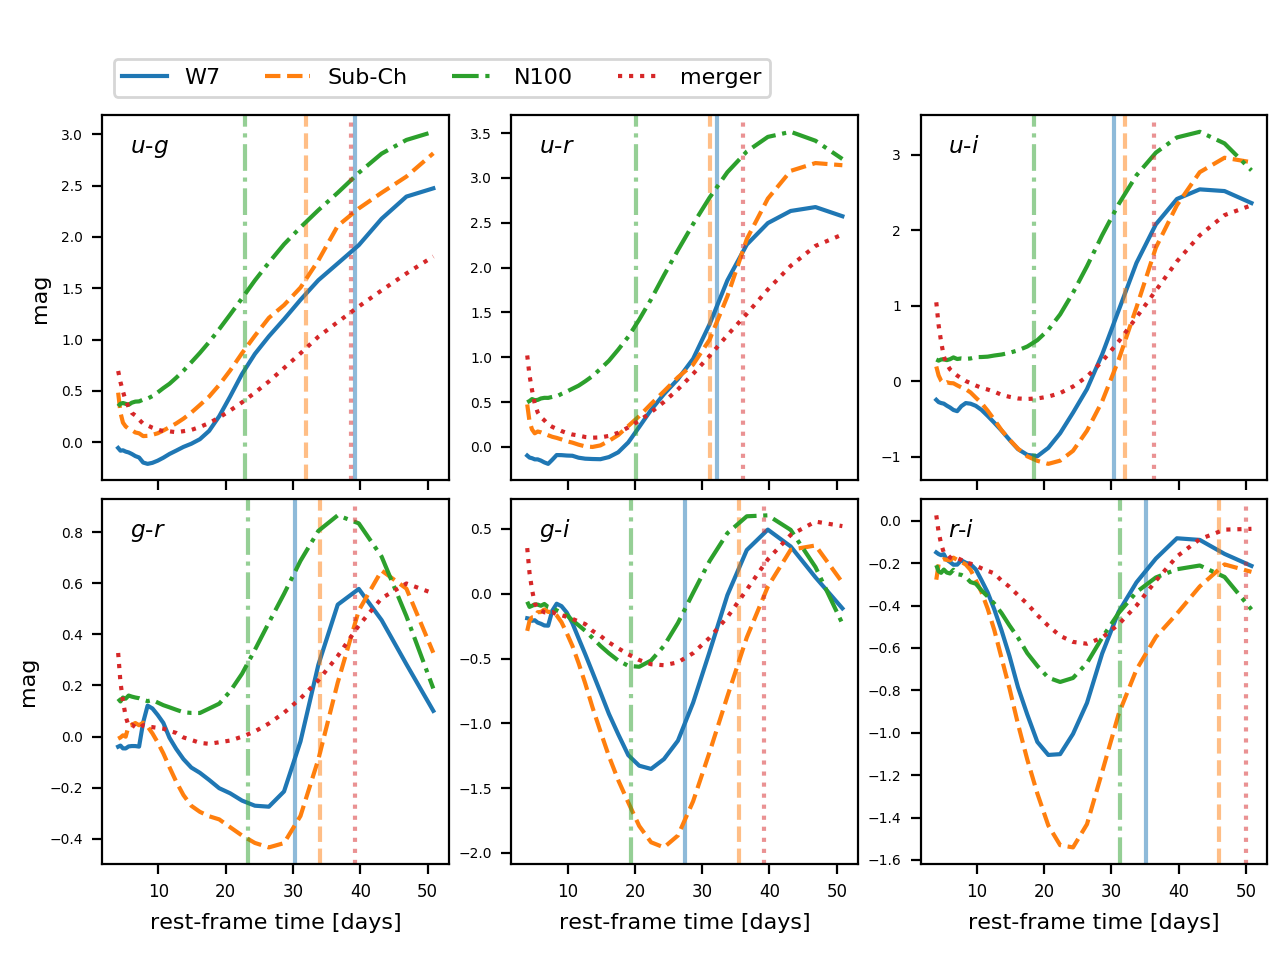
We find that six rest-frame LSST color curves exhibit features such as extreme points or turning points within the achromatic phase, which make them promising for time-delay measurements; however, only three of the color curves are independent. These curves contain combinations of rest-frame bands u, g, r, and i, and are shown in the figure below, where the vertical lines mark the mean duration of the achromatic phase.
To observe these color curves for typical LSN Ia redshifts, it would be ideal to cover (observer-frame) filters r, i, z, y, J, and H. If follow-up resources are restricted, we recommend r, i, and z as the bare minimum for using color curves and/or light curves since LSNe Ia are bright in these filters and observational uncertainties are lower than in the infrared regime. With additional resources, infrared observations in y, J, and H would be useful for obtaining color curves of SNe, especially at redshifts above ∼0.8 when they become critical. This study provides general guidance on the observing filters to follow up LSN Ia. In a real detection of a LSNe Ia where we have the SN redshift measurement, we can further refine and optimize the filters we have to employ to get promising color curves on a case-by-case basis.