H0LiCOW III. Quantifying the effect of mass along the line of sight to the gravitational lens HE0435−1223 through weighted galaxy counts.
In our quest to measure the Hubble Constant H0 from the lensed quasar
HE0435-1223 via the time delay method (Refsdal 1964), a major bias is potentially introduced by ignoring
the effect of mass in galaxies surrounding the main lens, and along the line-of-sight to it. With
reduced uncertainties on the other components of the time delay distance measurement, provided by
state-of-the-art time-delay measurements and modeling techniques of strong lenses from high-resolution
imaging, the line-of-sight/enveronmental effect remains an important source of uncertainty, contributing
up to ∼ 5% to the error budget on H0 (Suyu et al. 2010, 2013). While in H0LICOW IV we
explicitely model the nearest, most massive 1-5 galaxies, the net effect of the other galaxies, which
act as weak perturbers, can be approximated with a constant external convergence term κext
(Suyu et al. 2010). Due to the well-known 'mass-sheet degeneracy' (Falco, Gorenstein, & Shapiro
1985; Schneider & Sluse 2013) this term cannot be inferred from the observed strongly lensed image
properties, and instead requires a dedicated study based on wide-field, multi-band images, as well as
spectroscopy.
In this paper, we have estimated a probability distribution function for κext, from imaging
data obtained with CFHT, Subaru, Gemini, and the Spitzer telescope, as well as from spectroscopy (see H0LICOW II). Our main approach was to measure the number of galaxies in
a given aperture, and down to a given flux threshold, around HE0435-1223. Then, to measure in the same
way the number of galaxies in a large sky survey, the CFHTLenS (Heymans et al. 2012). By doing so, we
determined how over/under-dense the field around HE0435-1223 is, compared to a typical field on the sky.
Next, we counted the galaxies across simulated fields from a large-scale cosmological simulation: the
Millennium Simulation (Springel et al. 2005). Each field of the Millennium Simulation has a
corresponding κext value at its center, calculated via ray-tracing (Hilbert et al. 2009). By
picking up only the fields from the simulation which have the same over/under-density as the HE0435-1223
field, we were able to build a histogram of the associated κext values, hence estimate the
probability distribution of the external convergence.
We have been particularly careful in the implementation of the technique above, taking into account the
quality of both the HE0435-1223 field data and the CFHTLenS data, and adding similar relative
uncertainties to the Millennium Simulation catalogues. We have also considered multiple choices of
apertures (45" and 120"), as well as depth (i < 23 and i < 24 mag). More importantly, as suggested
by Greene et al. 2013, we measured not only over/under-densities in terms of galaxy numbers, but we also
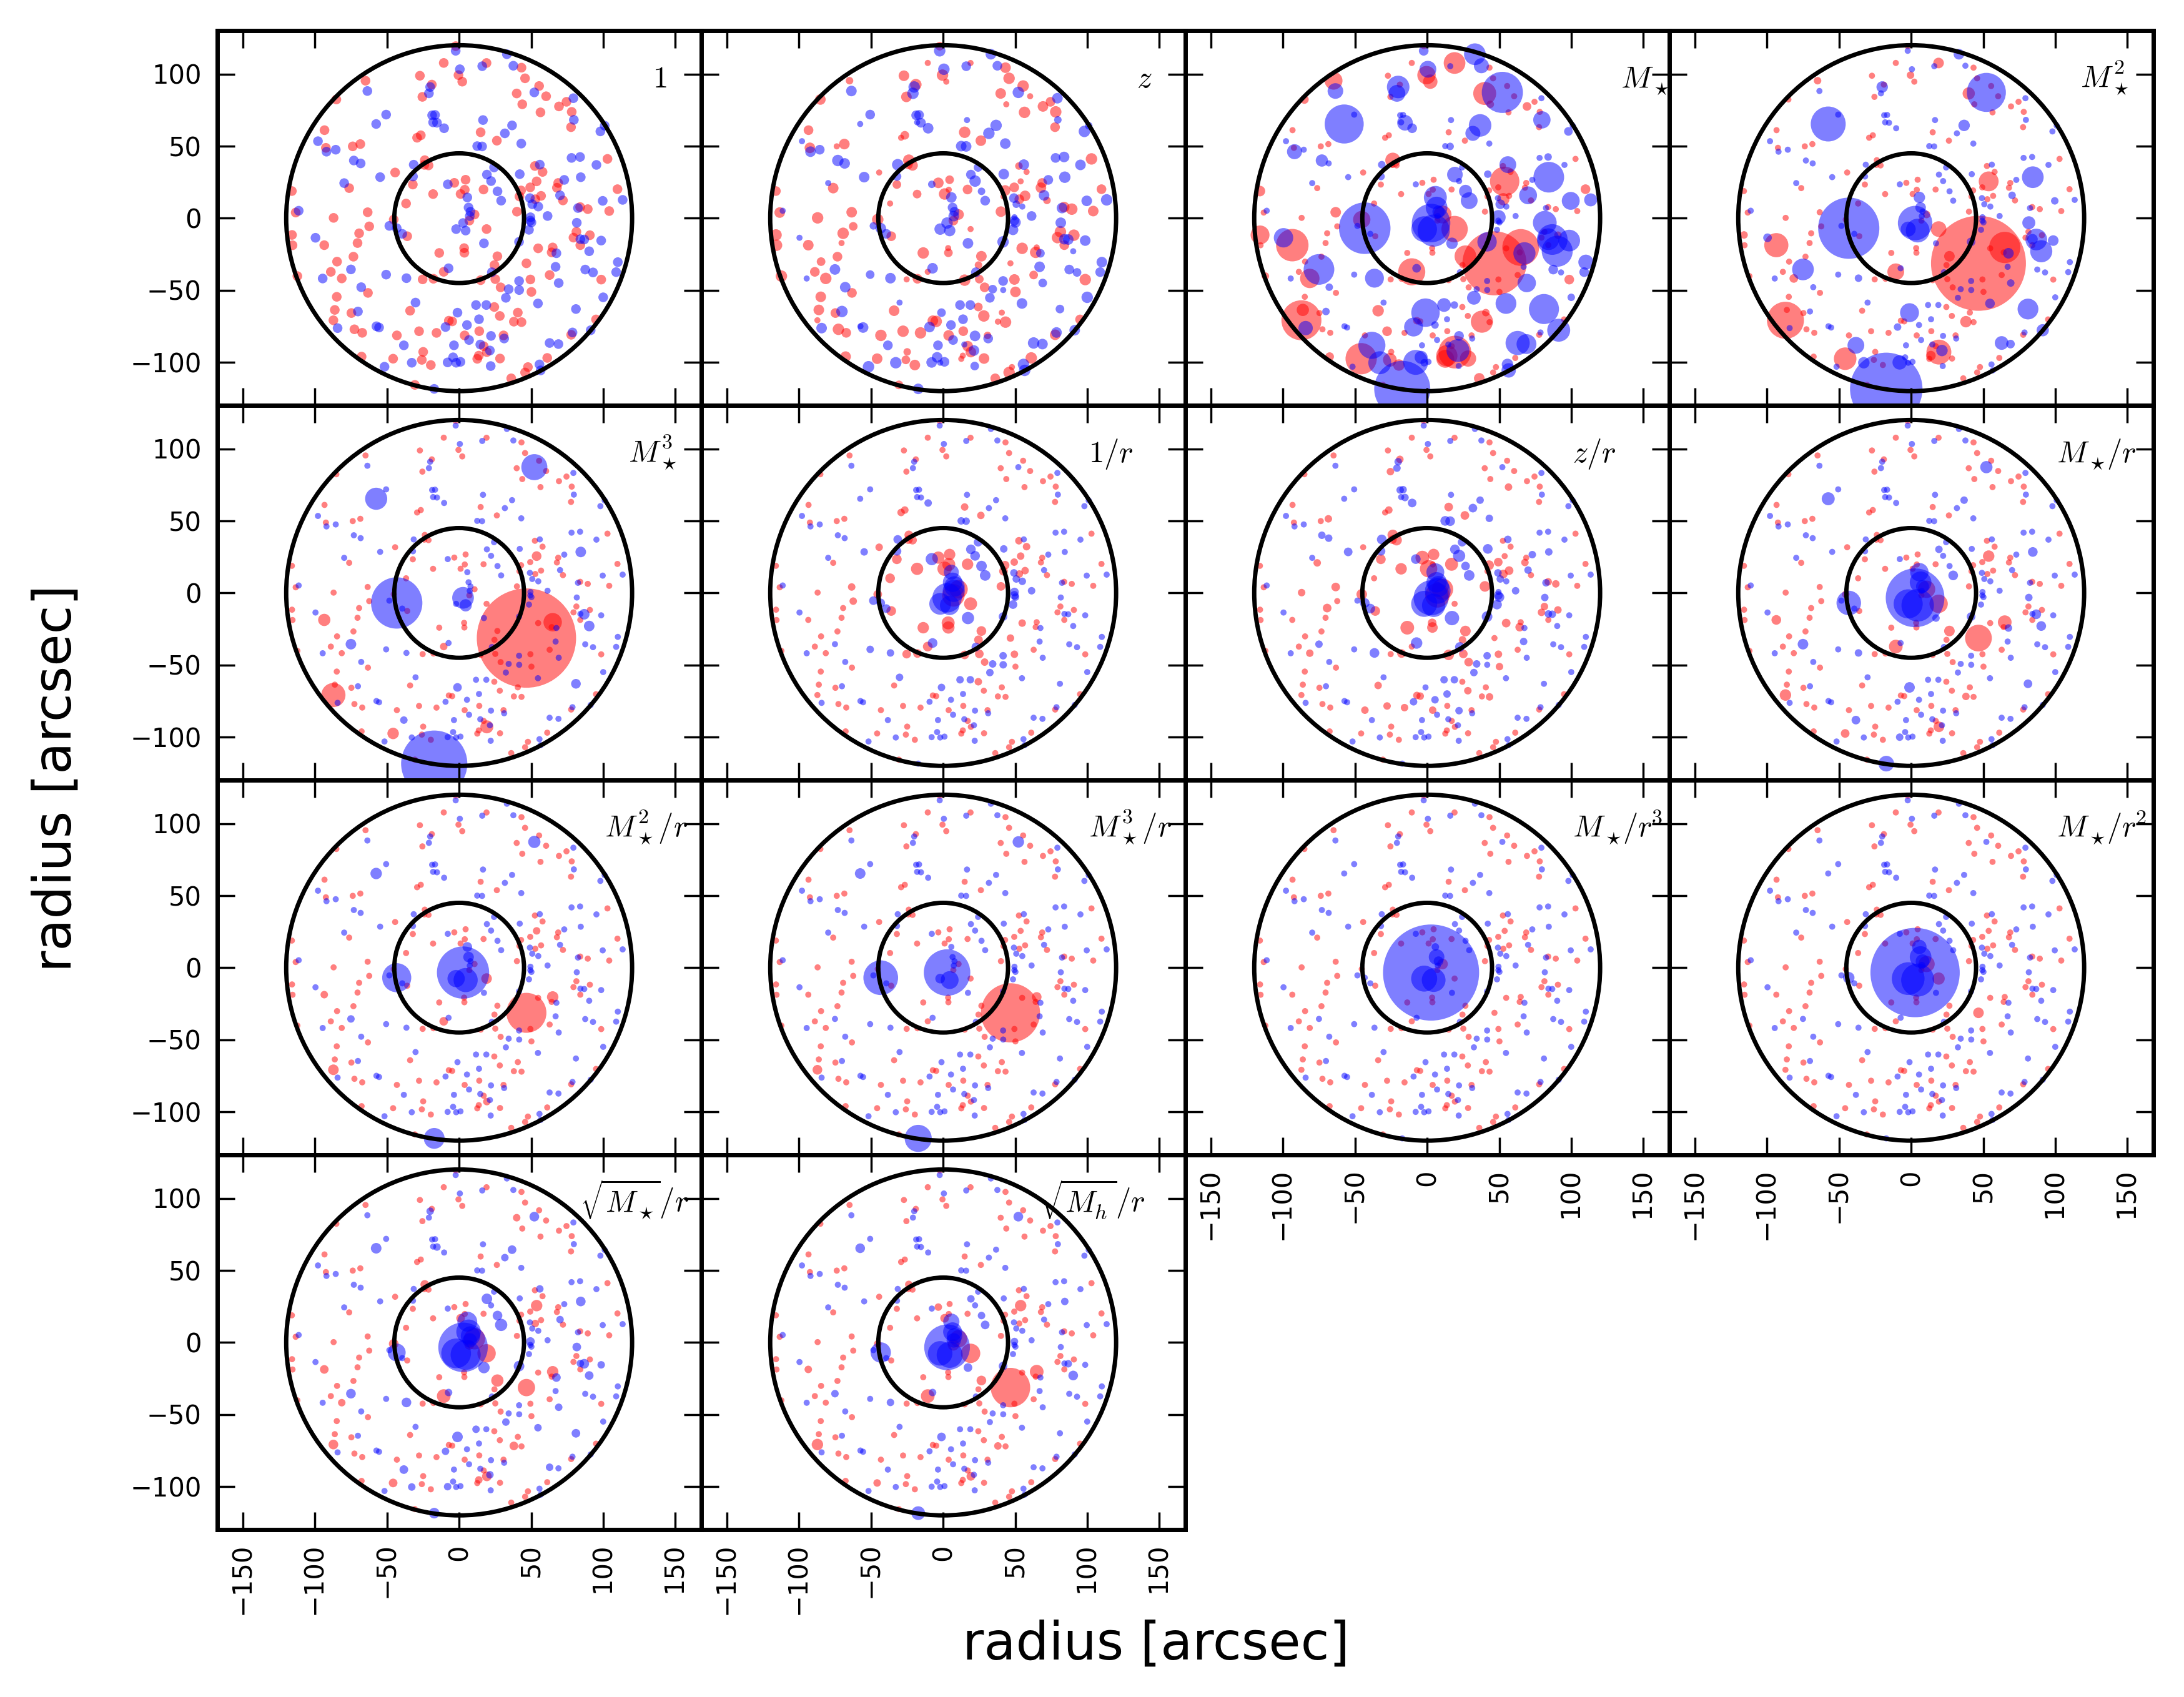
weighted those numbers by quantities more physically relevant to gravitational lensing. These include:
the distance of each galaxy to HE0435-1223 (or to the center of their apertures), their stellar masses,
and their redshifts. Corresponding to the weight that we use, the over/under-density we measure is
different, because distinct galaxies have different contributions (figure 1).
By selecting from the Millennium Simulation only fields which have similar over/under-density to HE0435-1223 when more than just a single weight is considered, we aimed to bring the inferred probability distribution for κext closer to its actual, unknown value. Figure 2 shows how selected weight combinations translate into probability distributions for κext.
Figure 2. Various selected weight combinations translate into probability distributions for κext.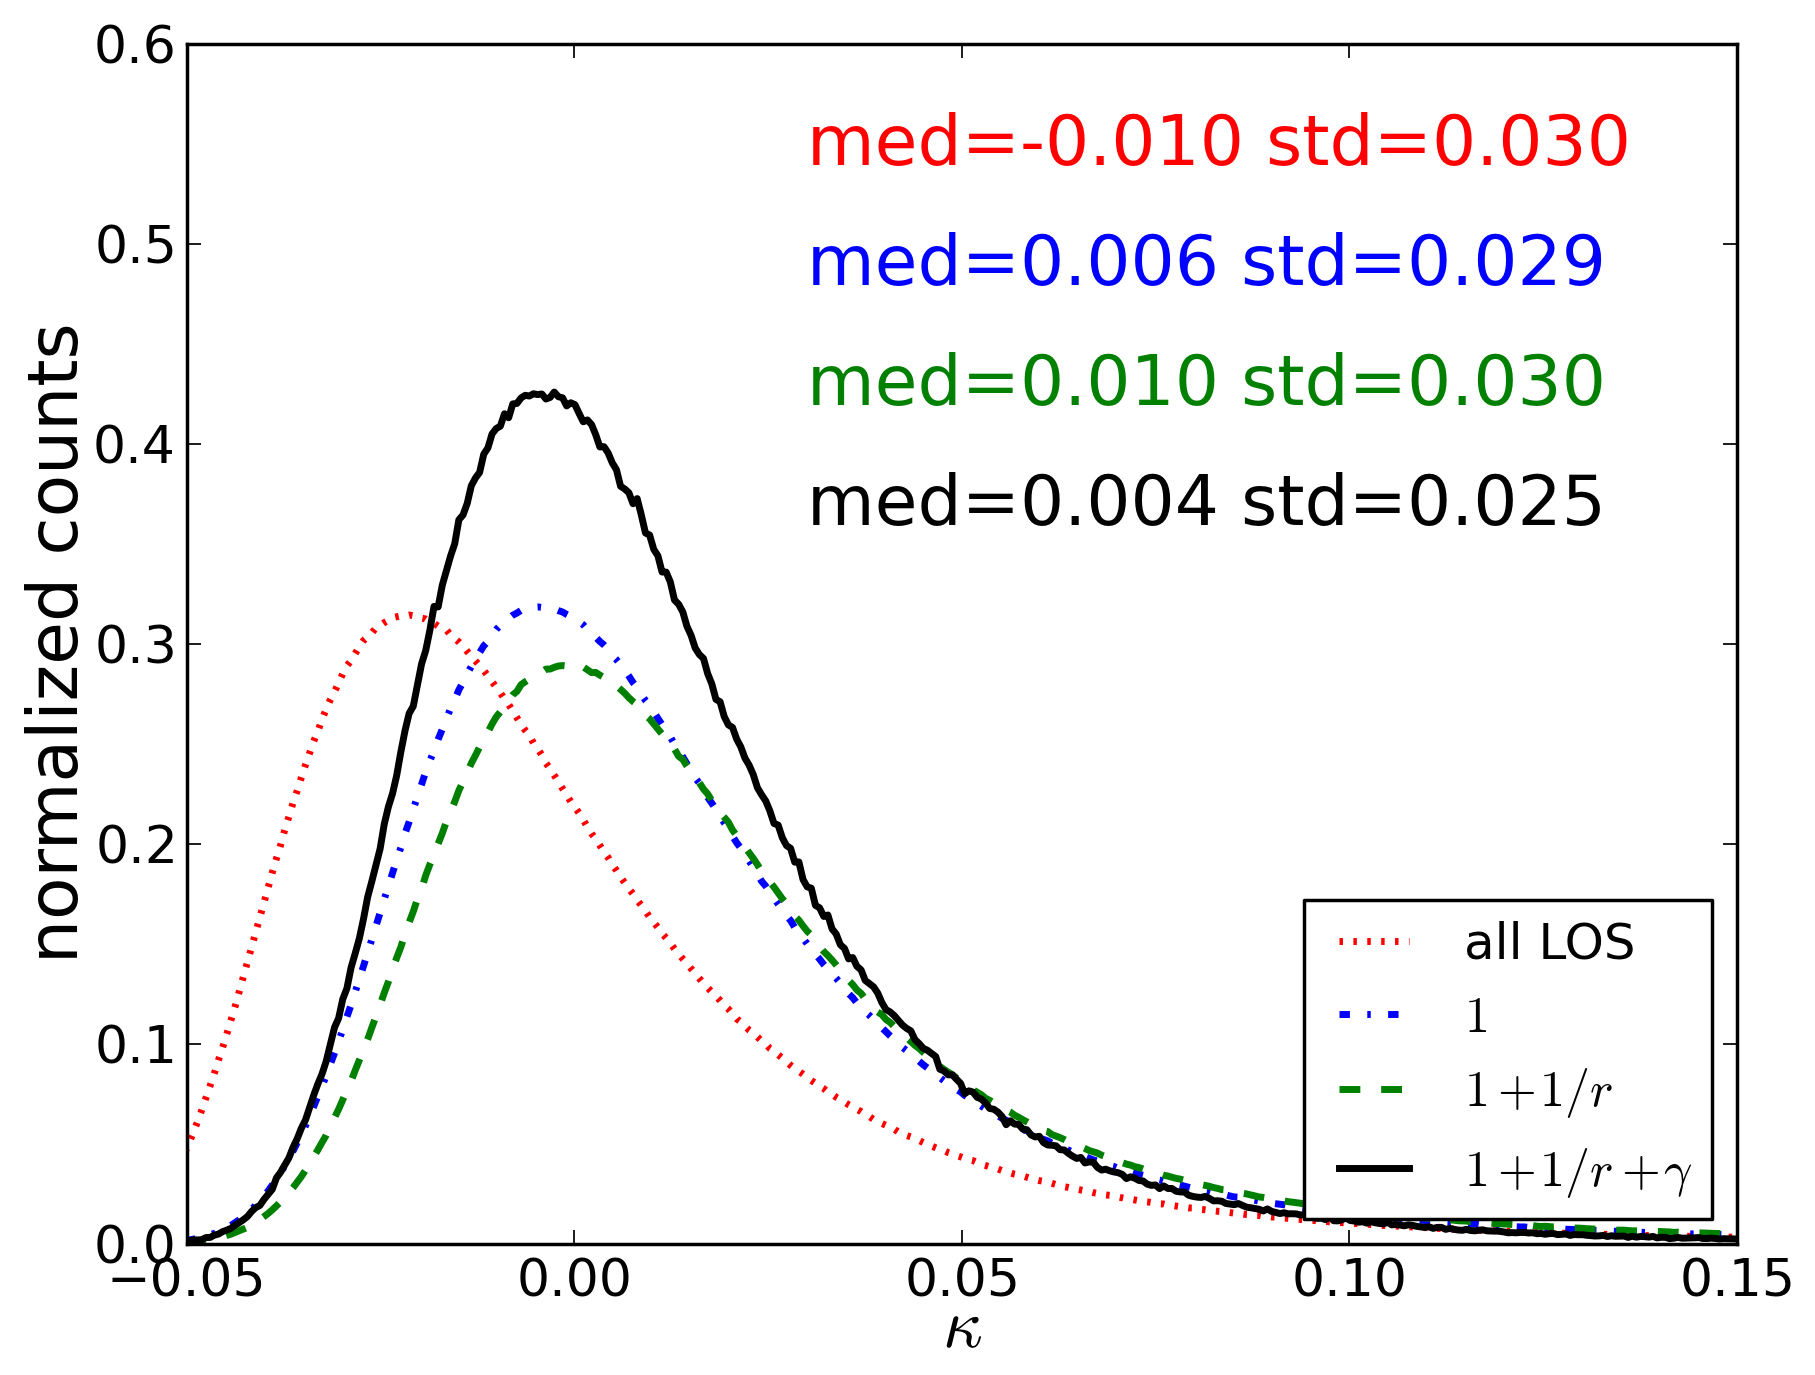
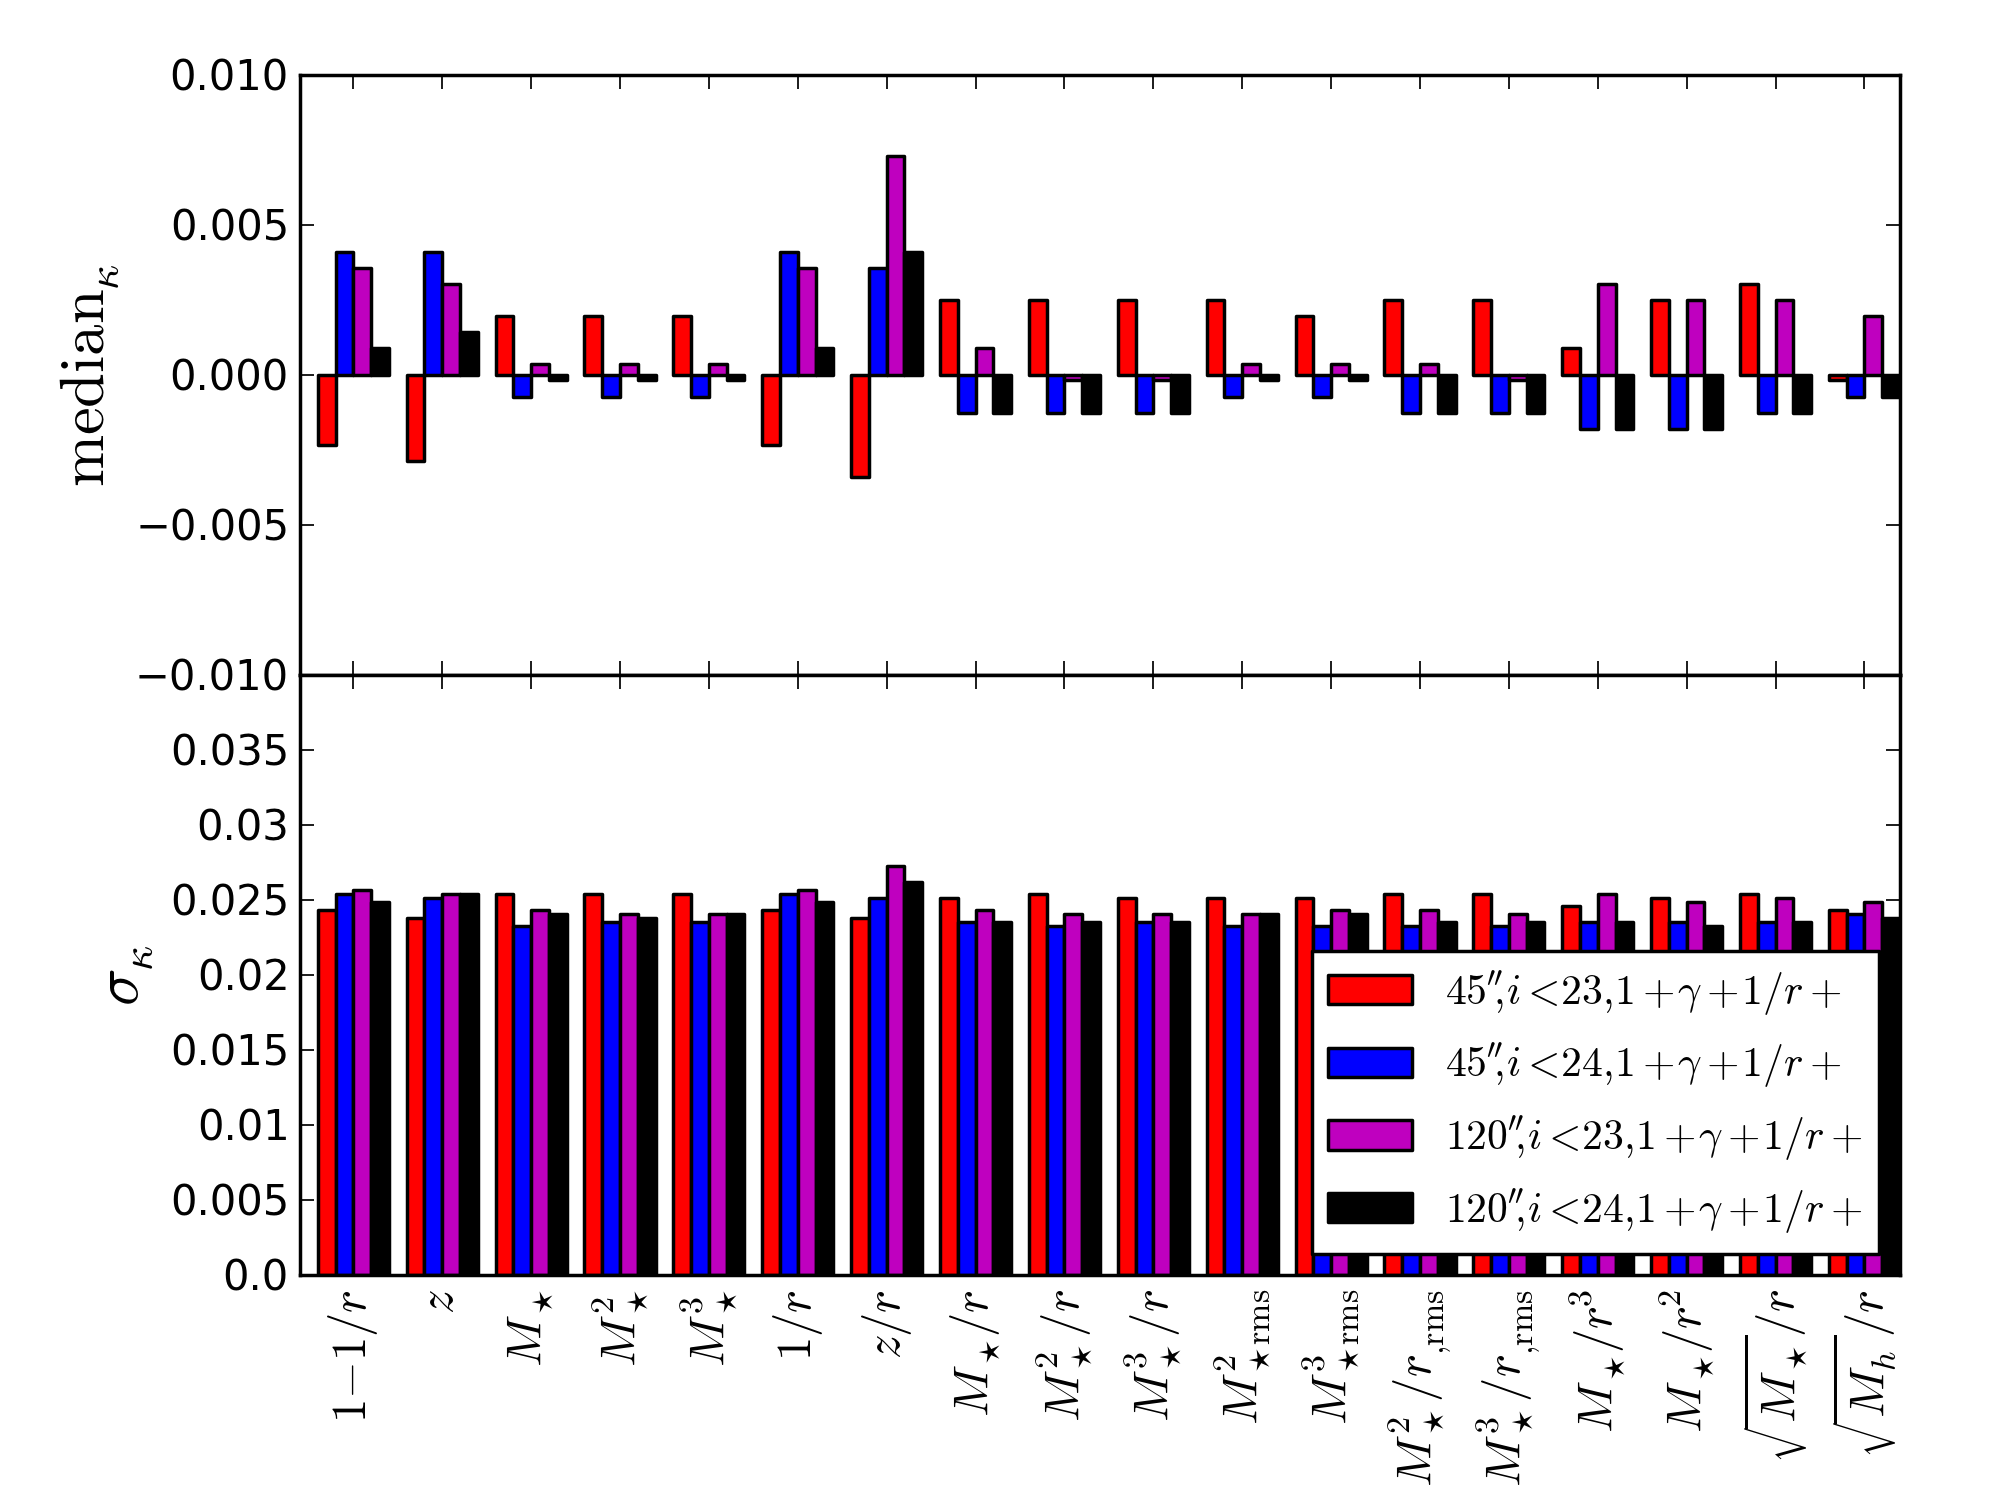
Our typical distribution for κext has a median of ~0, and a spread of ~0.025, corresponding to an uncertainty of ~2.5% on H0. We have found that the choice of weights, as well as aperture radius and flux limit, affect the median κext by only ~0.005 or less (figure 3), as long as we consider only fields from the Millennium Simulation with the same external shear as HE0435-1223.
Figure 3. The median and standard deviation of κext, for various weight combinations, aperture radii and limiting fluxes.