H0LiCOW X. Spectroscopic/imaging survey and galaxy-group identification around the strong gravitational lens system WFI2033-4723.
The value of H0 inferred from time-delay cosmography may be biased at a few percents level when galaxies and galaxy groups towards the lens line-of-sight are ignored in the lens modeling. This work focus on the characterization of the line-of-sight towards the lensed system WFI2033-4723, i.e. the fifth time-delay lensed quasar to be analyzed in the framework of H0LICOW. For this purpose, we have measured photo-zs, spec-zs and inferred stellar masses for the galaxies up to at least 2 arcminutes from the lens, down to i=23.0 mag. We have used deep multicolour imaging as well as multi-object and integral-field spectroscopy. In particular, we used grizY imaging from the Dark Energy Survey, proprietary u-band obtained with DECam, near-infrared HAWK-I (JHKs) and HST (F160W), mid-infrared IRAC-Spitzer data, and multi-object spectroscopy with ESO-FORS2 and Gemini-GMOS instruments. We have complemented those data with the spectroscopic catalog from (Momcheva et al. 2015) who spectroscopically measured the redshift of galaxies distant by up to 15 arcminutes,from WFI2033-4723, down to i ~ 21.5. In addition we have also used the exceptional capabilities of the ESO-MUSE integral-field spectrograph not only to derive spectroscopic redshifts for the objects closer in projection to the lens (with a projected distance as large as 30'' from WFI2033-4723), but also to obtain velocity-dispersions of the brightest galaxies susceptible to produce high-order perturbation to the lens potential. Thanks to our work, there are now 366 galaxies with a confirmed spectroscopic redshift in the FOV of WFI2033-4723, and 64 within a radius of 2 arcminutes,from the lens.
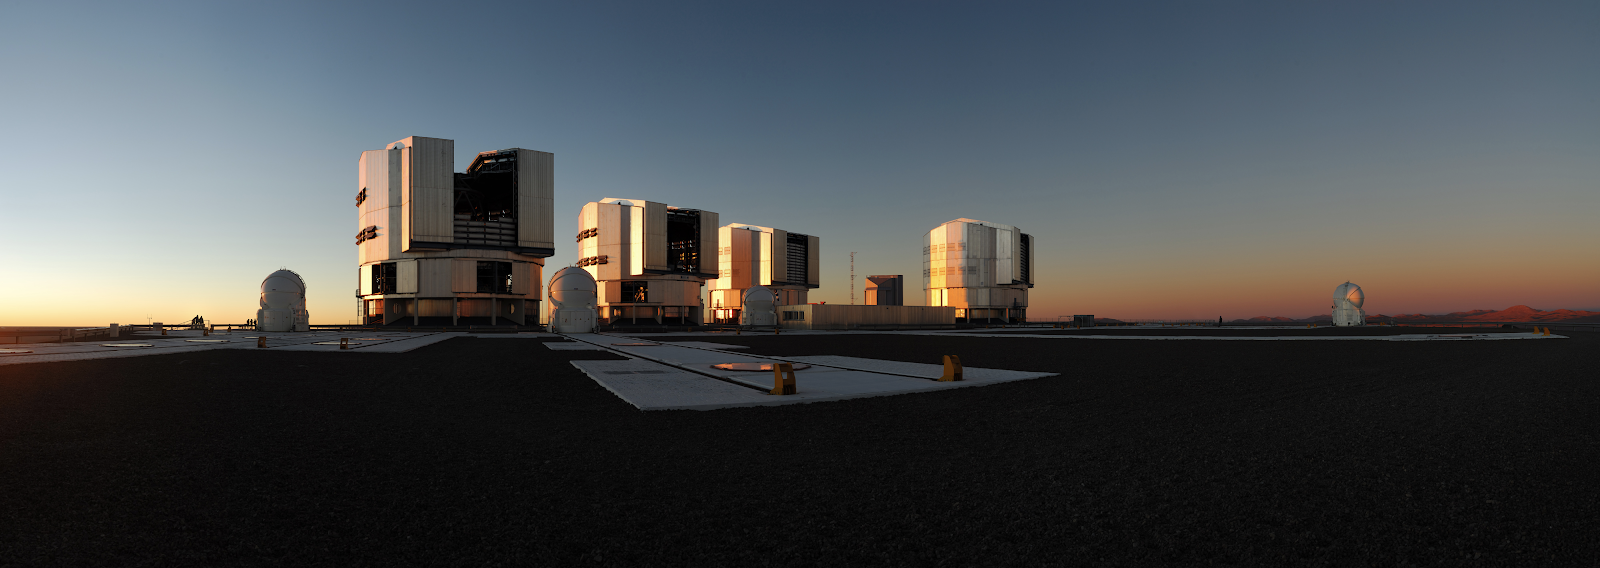
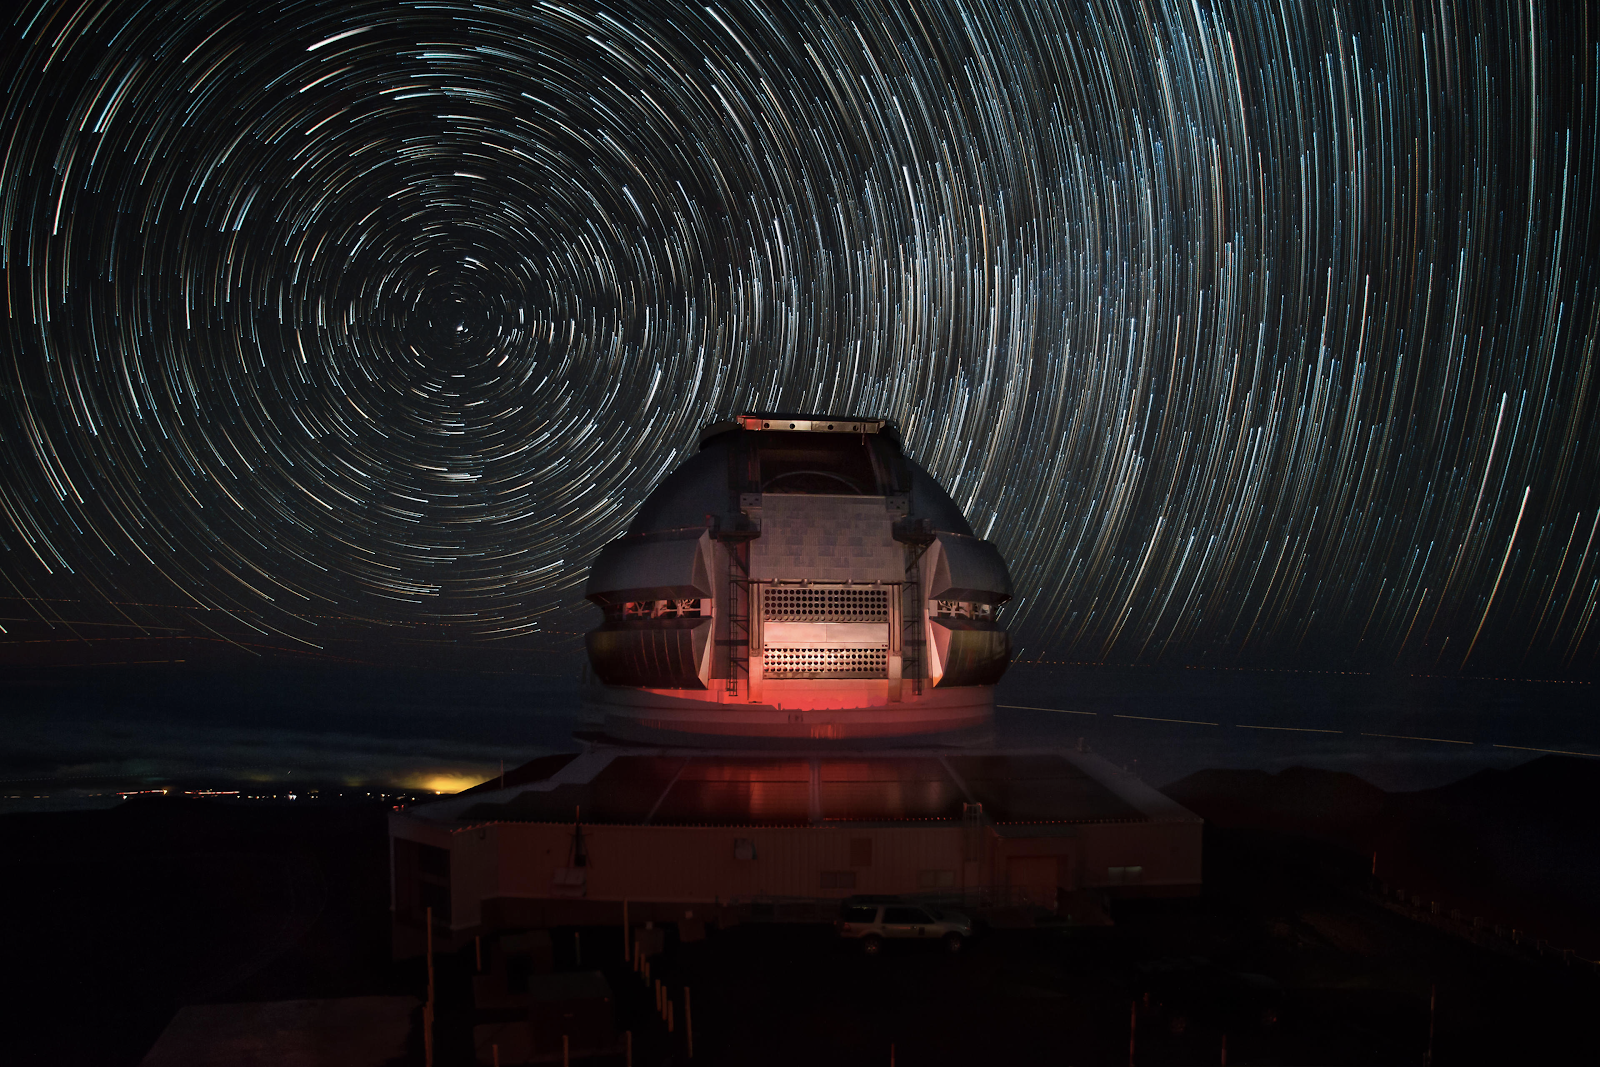
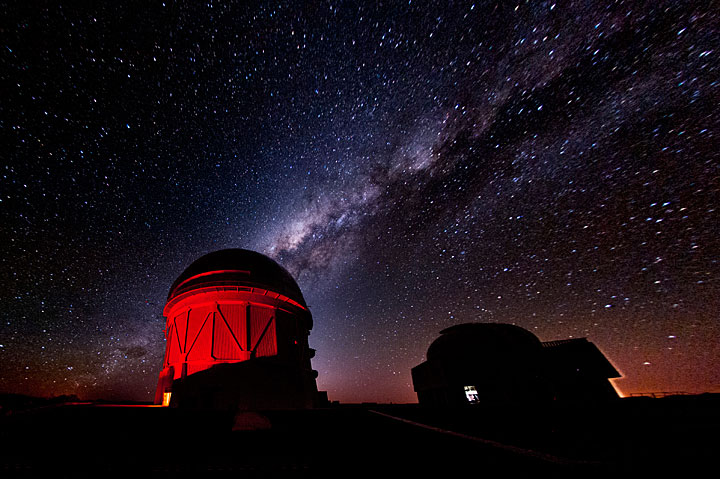
Fig. 1: Observing facilities used to perform the analysis carried out in this work. From left to right: the ESO Very Large Observatory (Credit: ESO/F. Kamphues), Gemini Observatory (Credit: Gemini / Joy Pollard), and the Cerro Tololo Inter-American Observatory that houses the Dark Energy Camera (Credit: Fermilab).
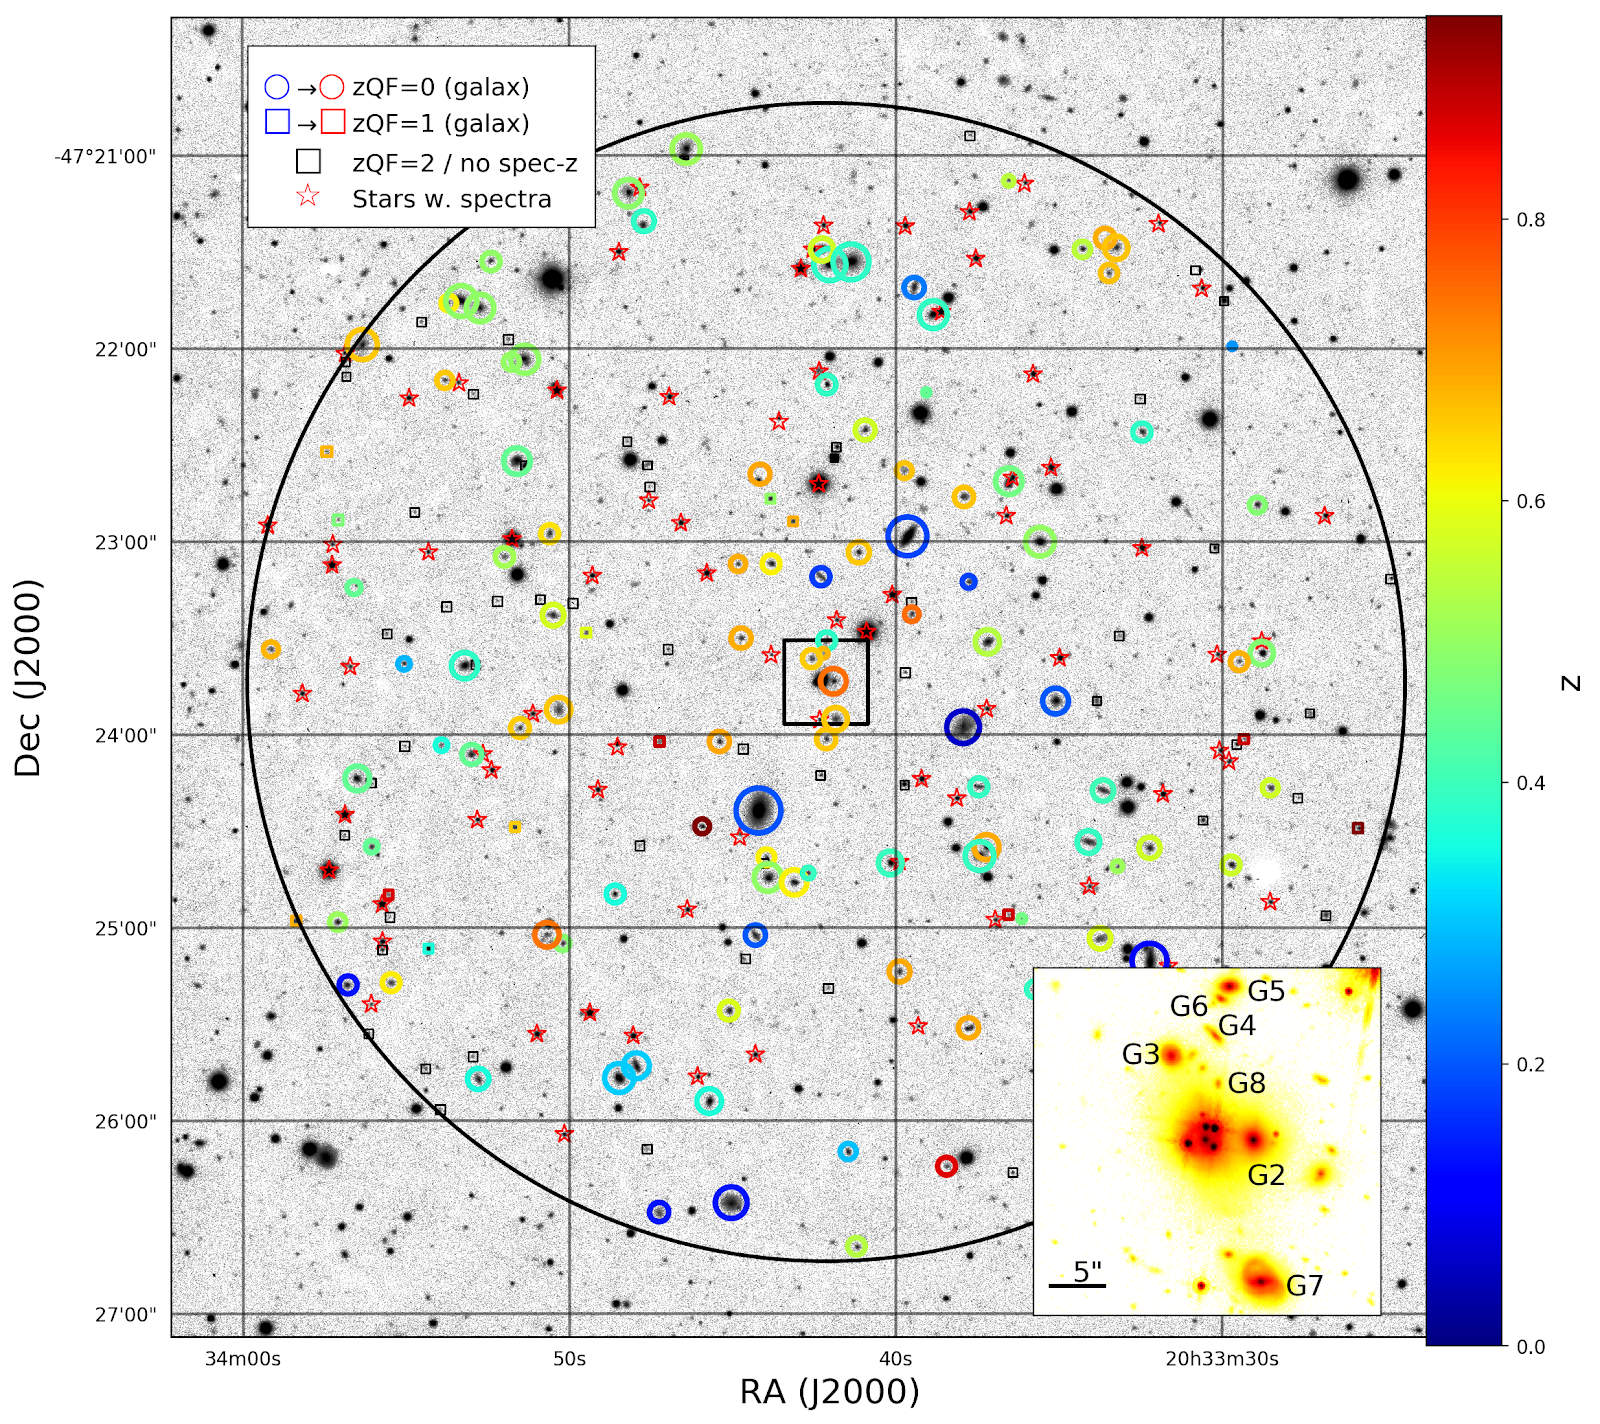
The flexion shift, namely the shift of lensed images produced by high order perturbation of the lens potential, is calculated for each galaxy/group and used to identify which objects produce the largest perturbation of the lens potential. We find that 2 galaxy groups and 3 galaxies towards the lens may be massive enough, and close enough in projection, to require an explicit treatment in the lens models: the galaxy group hosting the lens (hosting N = 22 spectroscopically confirmed members), a foreground group at zgroup = 0.4956 (N = 13), and 3 galaxies G2, G7 and G3 (see Figure 2) for which we also measure a central velocity dispersion. The statistical impact of the groups and voids on the lens model, as well as the comprehensive lens modeling of WFI2033-4723, including explicitly the main perturbers as identified in this work, are presented in a companion paper H0LiCOW XII.